 Learned Language Differences across the Continent
Abstract
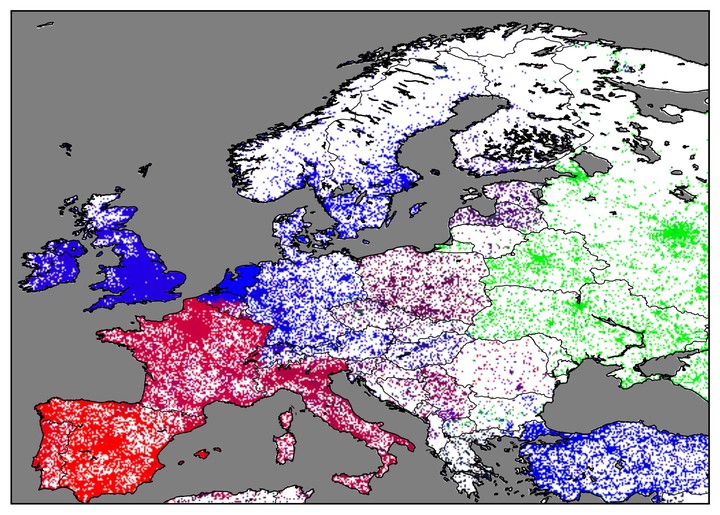
Geotagged Twitter data allows us to investigate correlations of geographic language variation, both at an interlingual and intralingual level. Based on data-driven studies of such relationships, this paper investigates regional variation of language usage on Twitter across Europe and compares it to traditional research of regional variation. This paper presents a novel method to process large amounts of data and to capture gradual differences in language variation. Visualizing the results by deterministically translating linguistic features into color hues presents a novel view of language variation across Europe, as it is reflected on Twitter. The technique is easy to apply to large amounts of data and provides a fast visual reference that can serve as input for further qualitative studies. The general applicability is demonstrated on a number of studies both across and within national languages. This paper also discusses the unique challenges of large-scale analysis and visualization, and the complementary nature of traditional qualitative and data-driven quantitative methods, and argues for their possible synthesis.